Diary
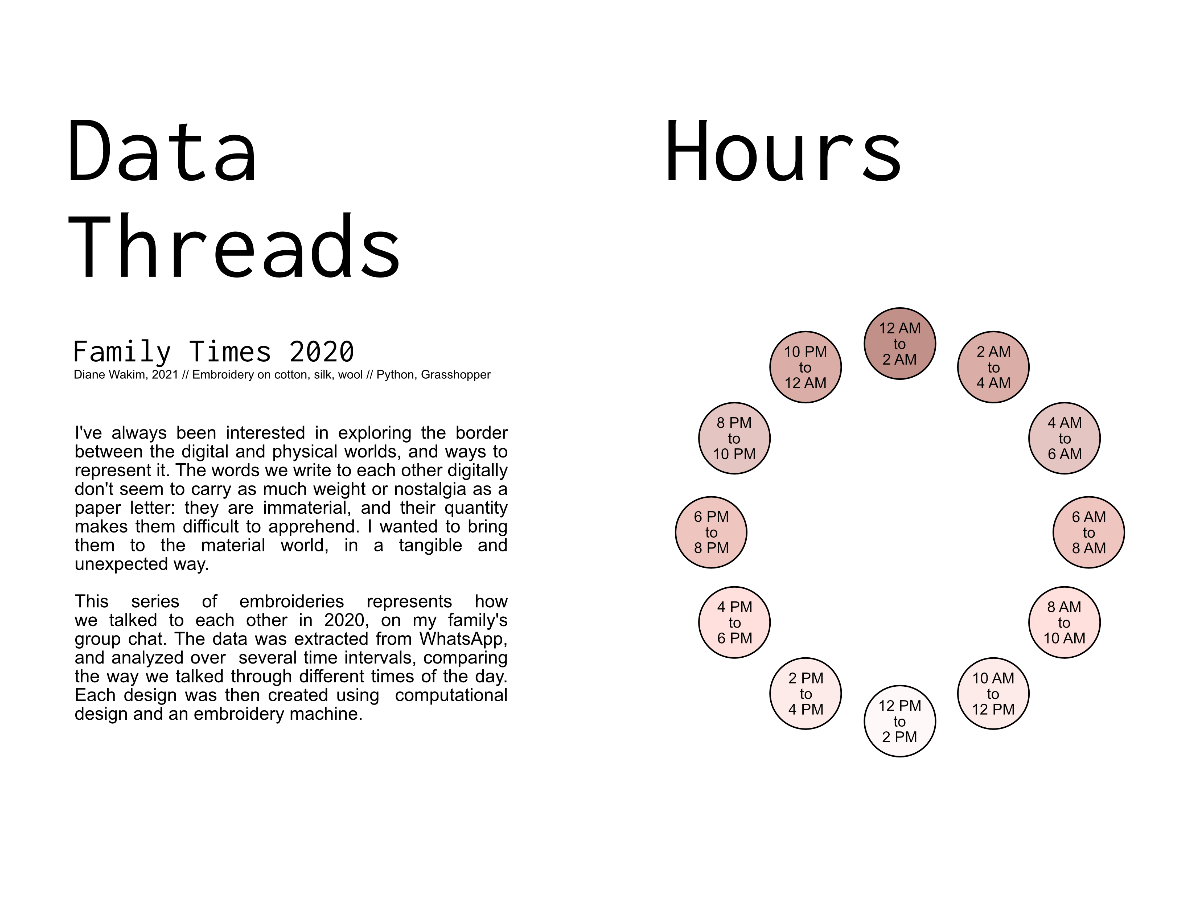
It is an exploration on data materialization in textile objects. I want to use personal, intimate data to generate designs and patterns to create textile objects. These emotional objects will function as a sort of textile archive, a memory support for this data.
Here is what I showed for the project presentations at the end of December, which is an improved version of the slides I made in week 11.
On this page, you can follow along the experimentations for my project. I have made a global planning, in which I try to set goals for every week, and then break them down in tasks. I will detail below these goals and struggles for each week.
🙈 Week 1 - Choices
📆 2021 - January 4th to 10th
My first week is all about choices. I have to decide on several things:
- Which data source will I be using?
- Which technical tool will I use to transform the data?
- I should create small data samples to experiment
Data source
At first, I wanted to experiment with different types of data, so I created samples from three sources:
- WhatsApp conversation
I took a sample of 1 month of messages between my boyfriend and I from the time we started dating, extracted this from WhatsApp and formatted it to a JSON file.
What I extracted from WhatsApp is a text file that looks like this:
13/10/2018 à 14:02 - Diane Wakim: Au fait, a priori je serai aussi à Paris le week-end du 27! Tu seras par là ? J'ai un truc le samedi toute l'aprèm, mais par contre j'ai pas trop d'endroit où dormir le vendredi et le samedi soir  😇
13/10/2018 à 14:53 - [Name]: Yes tu m'avais dit! Je crois que j'ai une soirée le vendredi soir par contre donc faut voir.
13/10/2018 à 16:21 - Diane Wakim: Ok! Je peux m'arranger autrement pour le vendredi 🙂 On verra ça quand on se voit cette semaine 😘
13/10/2018 à 17:18 - [Name]: Ok 🤗
An excerpt from a Whatsapp text file
So basically every line is a message that looks like : [date] à [time] - [name of sender]: [message].
I wrote a Python script which transformed this into a structured JSON with for each person, the data per day: number of messages, number of media sent, etc. For now, I'm focusing on basic data that concerns the messages, to see where I can go with a first prototype.
"Diane Wakim":{
    "dataPerDay": [
        {"date": "12/10/2018", "nbMessages": 5, "nbEmoji": 3, "nbMedia": 1},
        {"date": "13/10/2018", "nbMessages": 2, "nbEmoji": 1, "nbMedia": 0},
        {...}
        ...
    ]
}
Example of structured data for my messages
- Holiday photos
I wanted to try and do something starting with data from pictures. My initial idea was to take a bunch of pictures, extract the main colors composing them and try to generate something with this.
Here is an example I did with pictures from a family holiday:
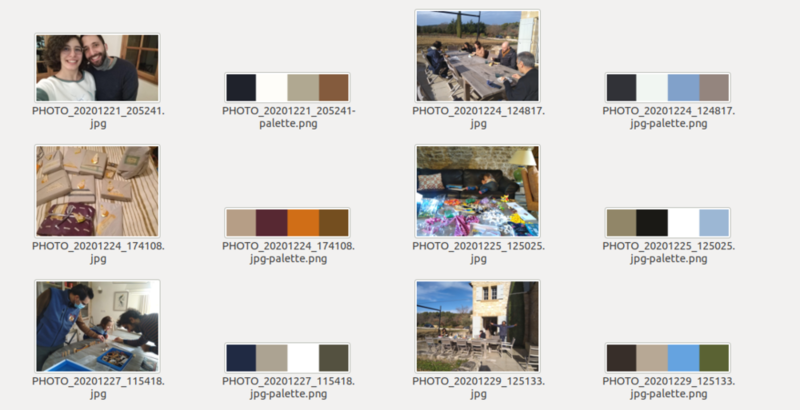
I used the command line tool extcolors to do this, limiting the colours number to 4:
$ extcolors PHOTO1.jpg -l 4 --image PHOTO1-palette
The result outputs a color palette, and the RGB for those colors, with the percentage of presence for each color (which is not shown in the color palette):
{
    "pictures": {
        // (R, G, B, %)
        [(31, 34, 43, 50.80), (254, 253, 249, 23.27), (176, 168, 145, 21.18), (132, 91, 61, 4.75)],
        [(49, 50, 55, 50.37), (241, 246, 242, 23.68), (129, 161, 202, 14.90), (148, 133, 126, 11.06)],
        [(182, 158, 134, 84.64), (87, 40, 50, 14.35), (208, 110, 23, 0.70), (116, 78, 31, 0.30)],
        [(145, 134, 104, 41.10), (26, 25, 21, 33.35), (255, 255, 255, 15.99), (156, 183, 212,  9.56)],
        [(32, 42, 67, 51.30), (172, 163, 146, 23.65), (255, 255, 255, 22.57), (84, 81, 64,  2.49)],
        [(55, 46, 41, 48.67), (183, 168, 149, 34.88), (101, 163, 224, 15.64), (90, 98, 51,  0.81)],
    }
}
RGB color codes for the pictures above
- Spotify personal data
I also wanted to do something with data generated from the music I listen to. I can access the Spotify API to get the top artists I listened to these past months, for example.
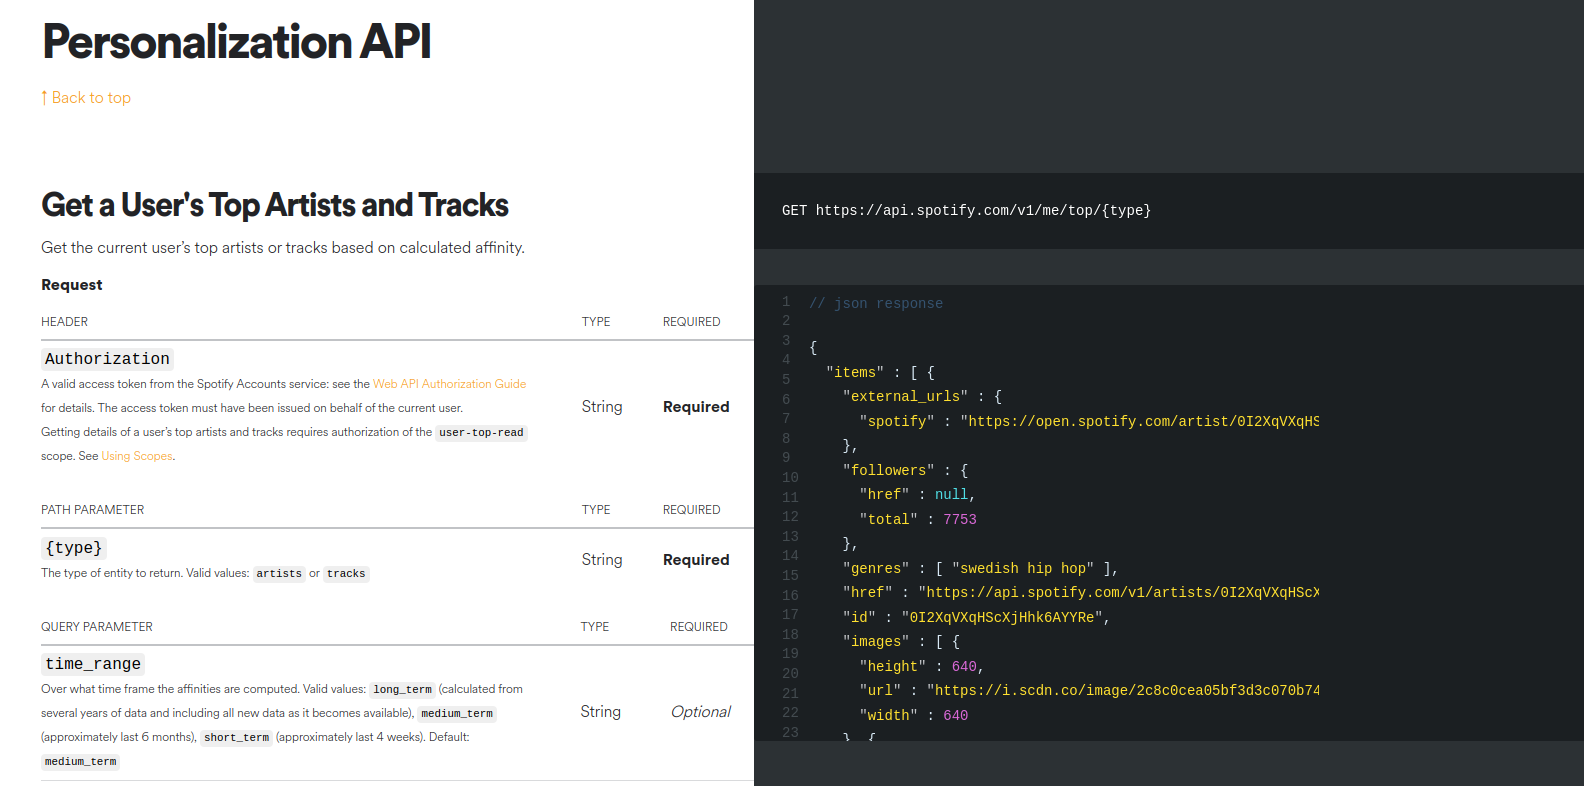
So I used the Spotify API with this endpoint: User's Top Artists and Tracks. But then I realized I could not get the number of times each was played, which was my initial idea for a design ; this information is not available in the API.
Technical tools
During the past months I really enjoyed learning how to use Grasshopper and Rhino, so this was my main option, though I did look into Processing as well.
What I wanted to know was: what can I feed Grasshopper and what can the output be?
I discovered there is a Grasshopper plugin to handle JSON, which is the way I usually structure data: jSwan. I can also use Python inside Grasshopper, with the GhPython component. I can output a visual, or gcode using the Xylinus plugin.
📊 Week 2 - Visual prototyping
📆 2021 - January 11th to 17th
I used the JSON sample from the WhatsApp conversation shown above to create a first visual prototype in Grasshopper.
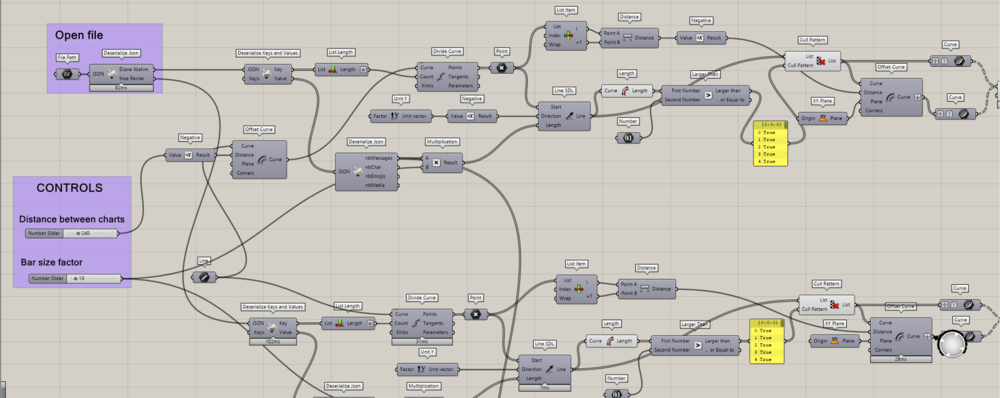
For now, I processed the data to have only basic numeral data, so I decided to do something geometric, with two bar charts opposing and mixing in the middle. Each bar represents the number of messages during one day.
In the following video you can see the parameters I play with to change the result:
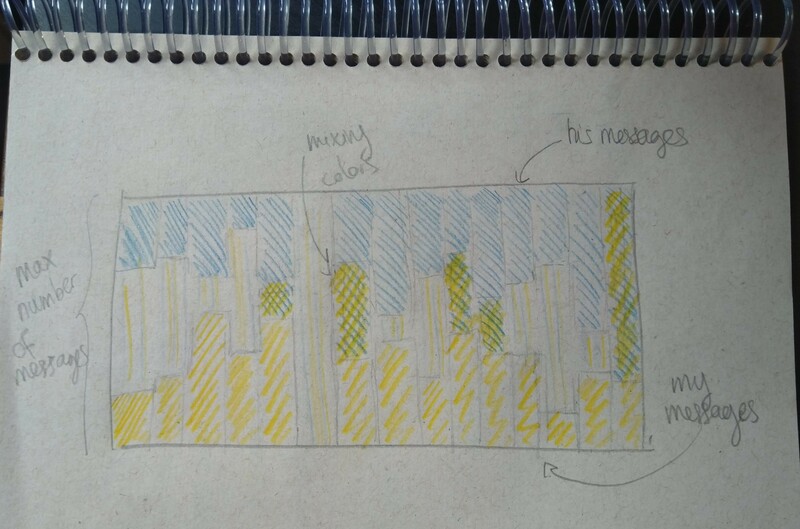
The geometry of it made me want lean heavily towards using the knitting machine to make a first prototype. We have a hacked knitting machine in the lab, so I set out to create a Bitmap image to feed it 🤓.
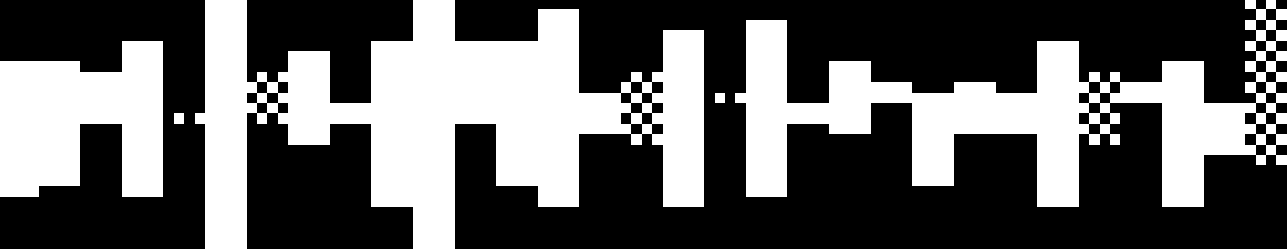
My initial idea was this one, where each person is one color; when mixing, the colors are mixed in a checkered pattern, and when there are no messages, there are successive lines of each color:
This means having 1 day represented with 2 rows or more of knitting. At first I tried creating a sort of grid directly from the surfaces I was seeing visually, but I then realised it was simpler to go directly from the data. So I created a Python script that I put in a GhPython component, which saves a Bitmap image by creating it pixel by pixel from the data.
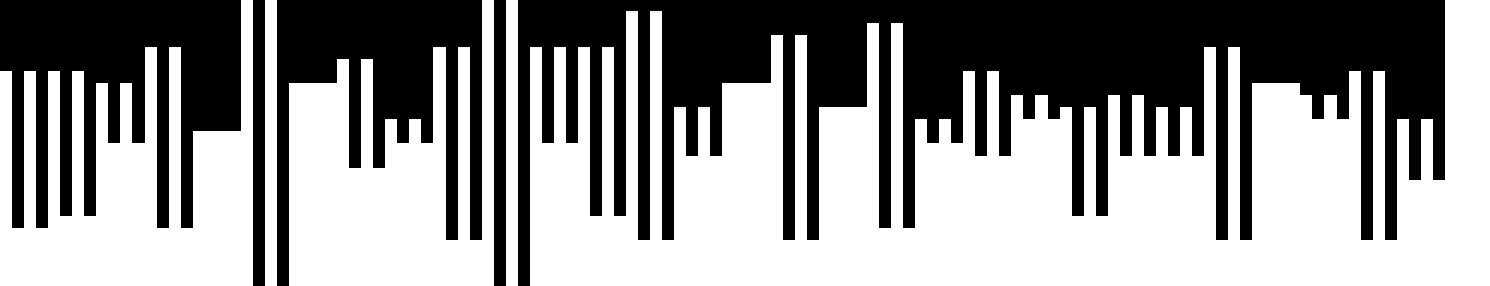
My first script did not achieve exactly this, but I ended up with a Bitmap image that was good enough to try and knit it!

The original image is very small, as it is only 24 by 124 pixels; here is a zoomed-in version:
Note: for now, I can't seem to be making the last part (saving the Bitmap image on the file system) work within Grasshopper. I did it from my Python terminal, I will have to check why this does not work, I think it is a writing rights problem.
🧶 Week 3 - Knitting a first prototype
📆 2021 - January 18th to 24th
The knitting machine we have at Le Textile Lab is a Brother KH-950i, hacked by Pauline with an AYAB board. She taught me how to use it this week!
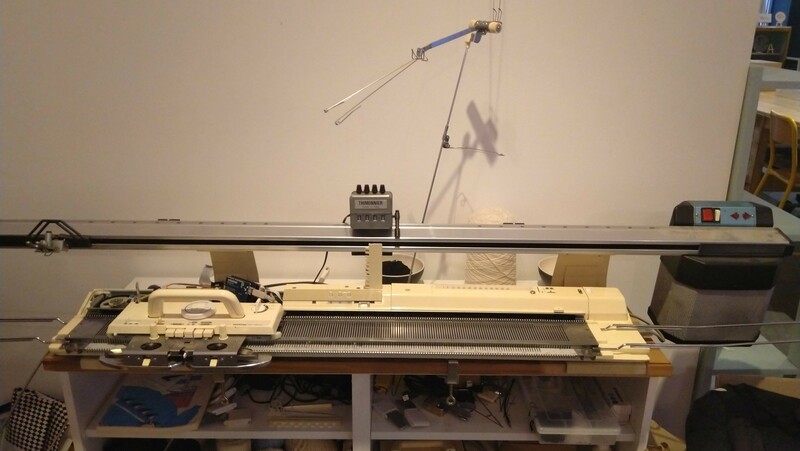
Our Brother KH-950i
Here is the first prototype, that matches the image I created last week:
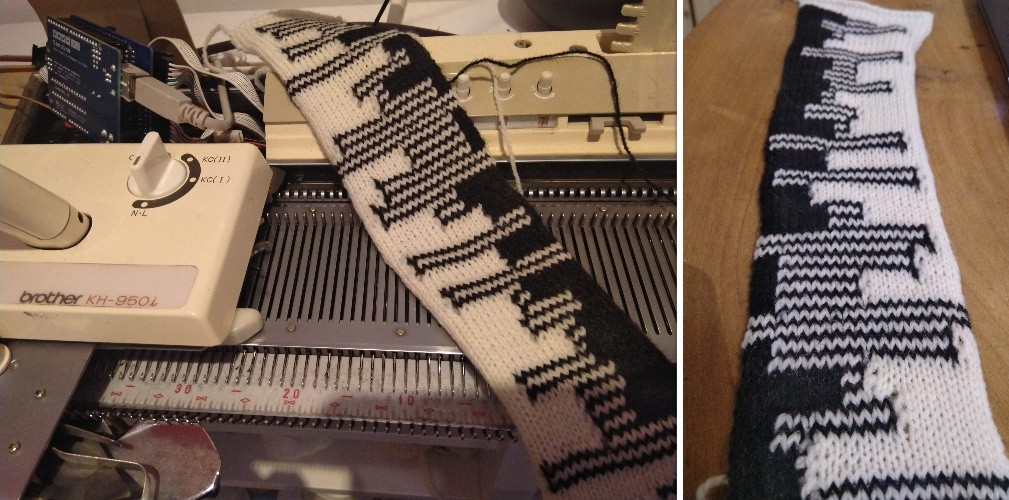
Even though it was not quite what I wanted visually, I was very happy to have made a first materialization of data!
I then fixed the script to get the image I initially wanted:

Once again here is a zoomed-in version:
On this one, the two sides are represented using the same color (black), and the second color (white) appears only when mixing or in-betweens.
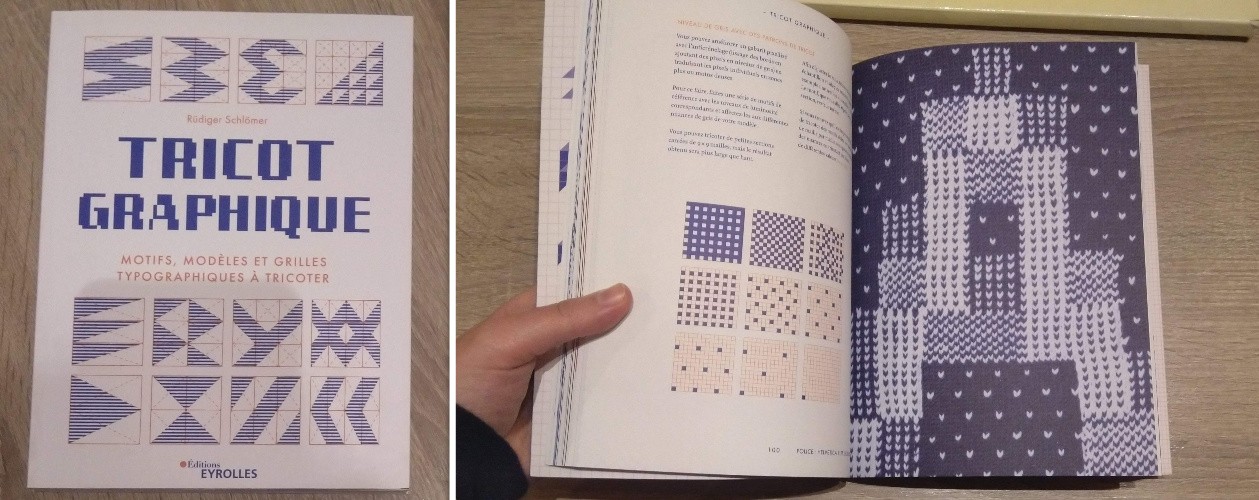
I won't knit it just yet, because I want to explore a bit more what I can do with the machine in terms of textures and patterns, with only two colors for now. I have these two books with a ton of info and ideas to get inspired:
"Tricot Graphique" by Rüdiger Schlömer, which has a lot of interesting grids like in the photo below, using two colors only:
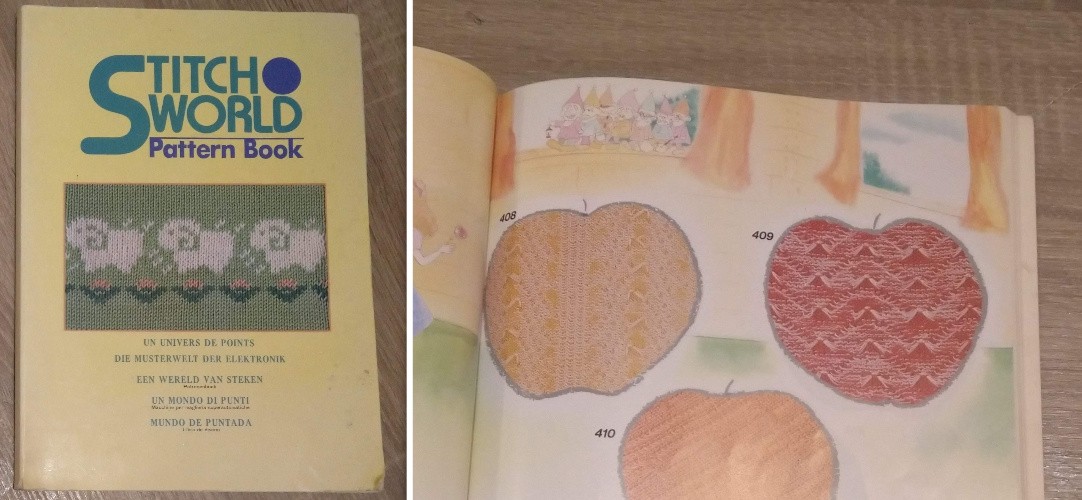
And the Brother StitchWorld Pattern Book, which gives me possibilities to work on the back of the knitting to create knots or different textures:
💡 Week 4 - Intent
📆 2021 - January 25th to 31st
The end of last week and the beginning of this one have been a bit hard: I'm having trouble to focus, my mind is filled with a lot of things, but I can't seem to get something out of it. I feel like I'm being too driven by the technical possibilities, and not enough by what I want to do or show with this project.
I tried to think more about the intent of the project, about what it means to me:
Making the invisible visible
Showing the intangible
Materializing what matters to us among a mass of data
Showing data in a physical form for a more practical engagement
I tried to imagine end pieces I wanted to make, from different types of conversations.
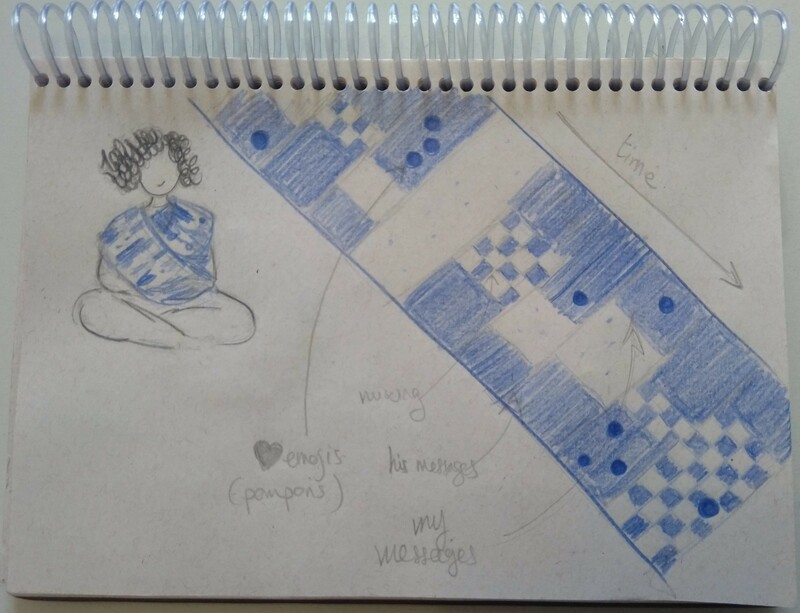
- Love Letter
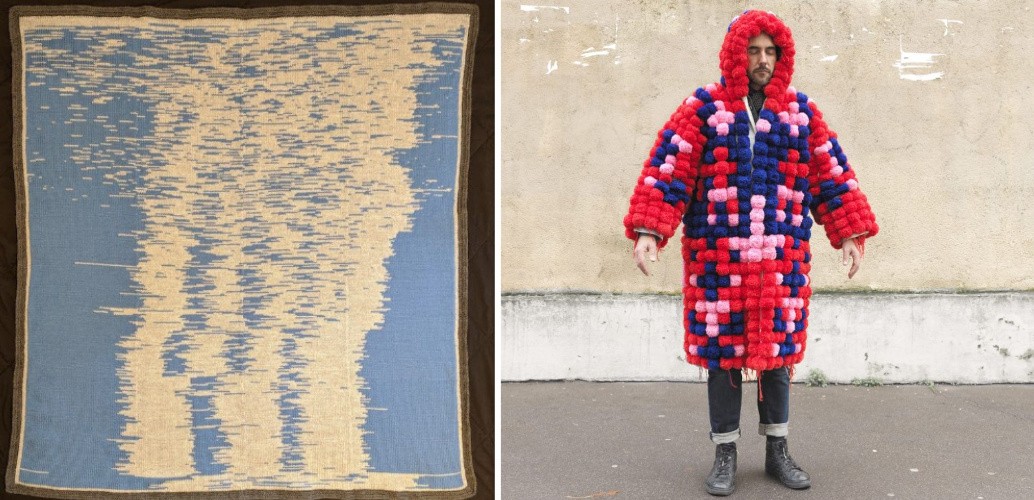
A couples' conversation, comforting and linear: day-to-day data, on a scarf or a blanket. Every day is represented by a few rows, where the amount of messages of each person meets in the center. I'm still not sure about the "mixing" texture. I'd like to add something manually, like pompons for the ❤️ emojis sent during each day, for example.
Some inspiration: the Sleep blanket by Seeung Lee (yes I talk about it all the time...!), and a jacket made of pompons by Damien Poulain:
- Family Weather
2020 was a rough year, and my family's group chat was an important link to them. I want to make different snapshots of how we talked to each other during this time.
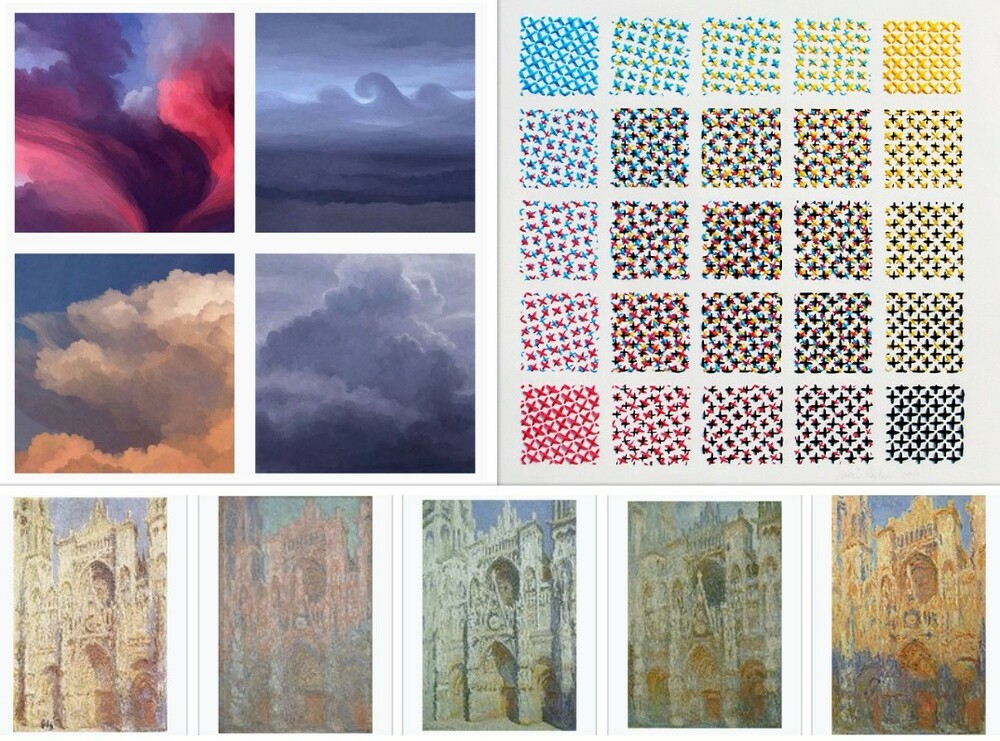
I'm imagining generating something like clouds for each person in the group chat: everyone starts out as a small circle, and then grows organically according to its properties. Everyone has different properties related to the number of messages they sent during that time span, the positivity of the messages, etc.

I want to try and make snapshots like these using data from different times of day (e.g.: every morning during 2020), to have a kind of "meteorological report" of the past year.
Some inspiration: @clever_reports "meteorological fictions", Evelin Kasikov's CMYK embroidery, and Claude Monet's series of the Rouen Cathedral at different times of the day:
- Friends Topography
A sort of topographic or geographical representation of a group of friends. I have a huge amount of data for this: around 32000 messages over more than 5 years from the same groupe of 20 people.
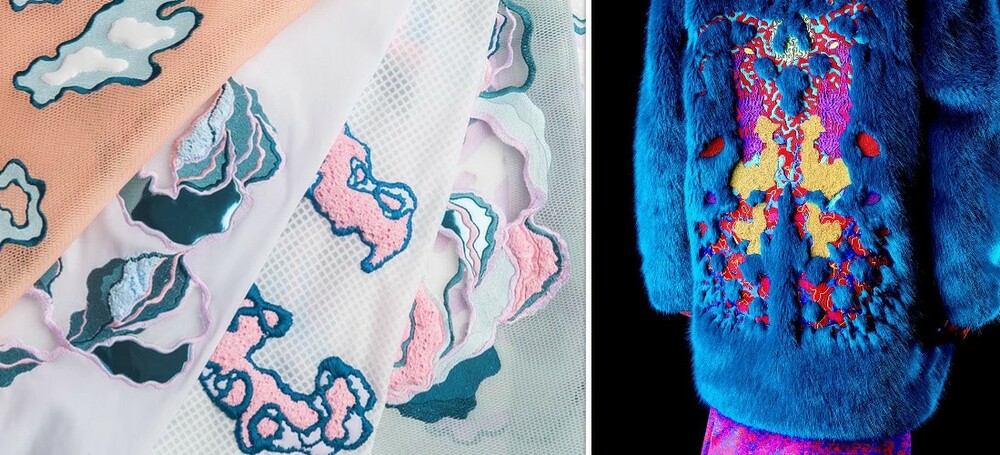
I'm imagining a sort of landscape with rivers, towns, mountains... Embroidered, with maybe added 3D prints? I'm very inspired by these embroideries that have a lot of texture, by Gemma Blackwell and by James Bowen:
I'm also inspired by topographic maps, like the ones below.
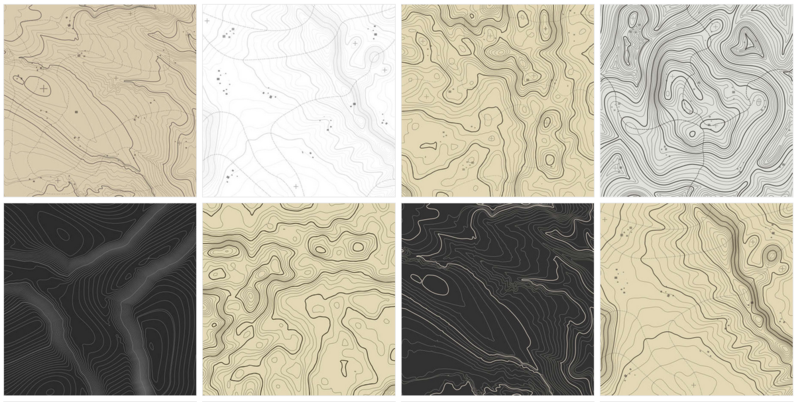
Topographic map prints from 123rf.com
I'd really like this one to be interactive, but I'm not sure in which way yet!
🔁 Week 5 - More prototyping
📆 2021 - February 1st to 7th
I prepared a set of data to test the idea I had with my family group chat.
Here is what the sample data looks like:
{
    "names": ["Fadia", "Béchara", "Ziad", "Anne", "Nabil", "Audrey", "Diane", "Noé", "Elie", "Maya"],
    "nbMessages": [37, 18, 54, 8, 35, 22, 16, 0, 0, 20],
    "nbEmojis": [10, 2, 5, 1, 4, 6, 8, 0, 0, 9],
    "positivity": [75, 23, 13, 55, 73, 68, 32, 1, 1, 42],
}
Sample data from my family group chat, from January to June 2020, morning hours
(Note: the posivity rate is speculated here, I don't have the data yet)
What I wanted to do was to use a differential growth algorithm in Grasshopper, a bit like what we did in week 7 assignment. But here, I want closed lines growing at the same time, and not colliding with each other... 🤔
I found something that looked almost like that on the Rhinoceros forum, with the code attached:
Here closed lines are growing, so I modified this definition to suit my needs, which gave me something like that:
On a completely different note, I tried something new with the knitting machine: using wool and nylon thread.
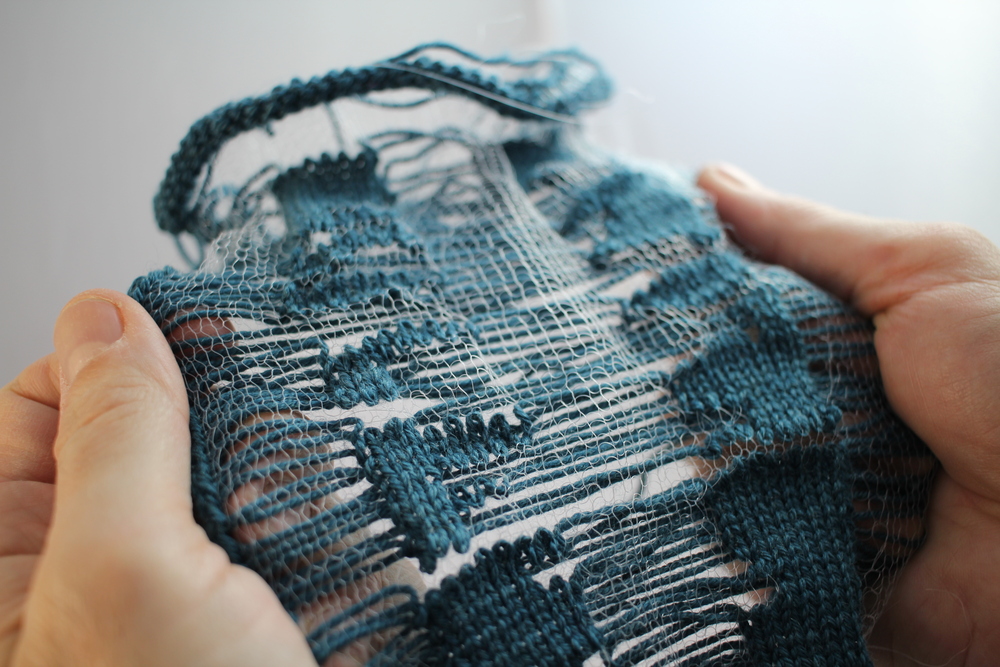
I wanted to test two very different thicknesses of fabric knitted together, but I had a few problems with this:
- After a while the nylon thread broke;
- I realised afterwards that a cable from the Arduino was unplugged, so the pattern is not the one of the image I used. It still mainly worked though, the pattern is just weirdly symmetrical and missing some parts.
🧵 Week 6 - Materials
📆 2021 - February 8th to 14th
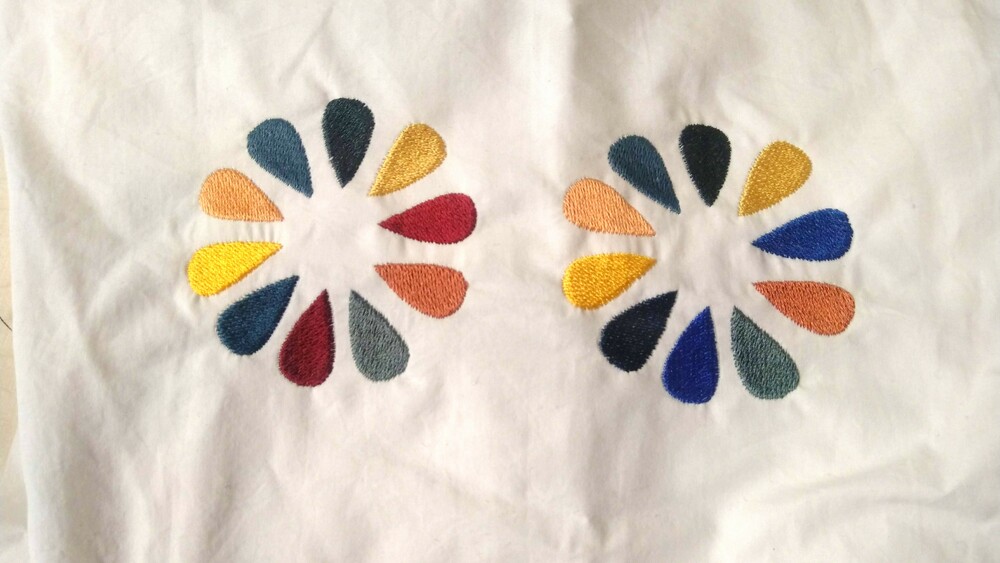
I created different patterns in Grasshopper from the same data sample, and used the embroidery machine to make the prototypes:
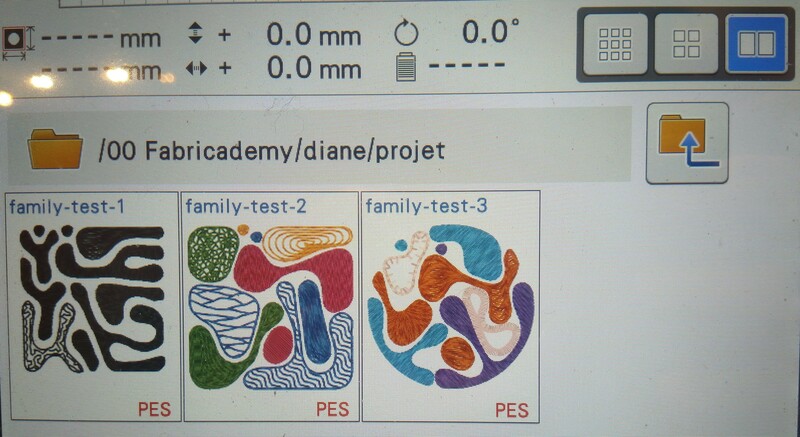
Below are the two prototypes are made. Both represent the same data, but the bounding surface was different: a circle in the first and a square in the second one. On the first one, I tried different embroidery points, and different textures by using appliqué. The colors don't really mean anything at the moment, I just wanted to try out different things.
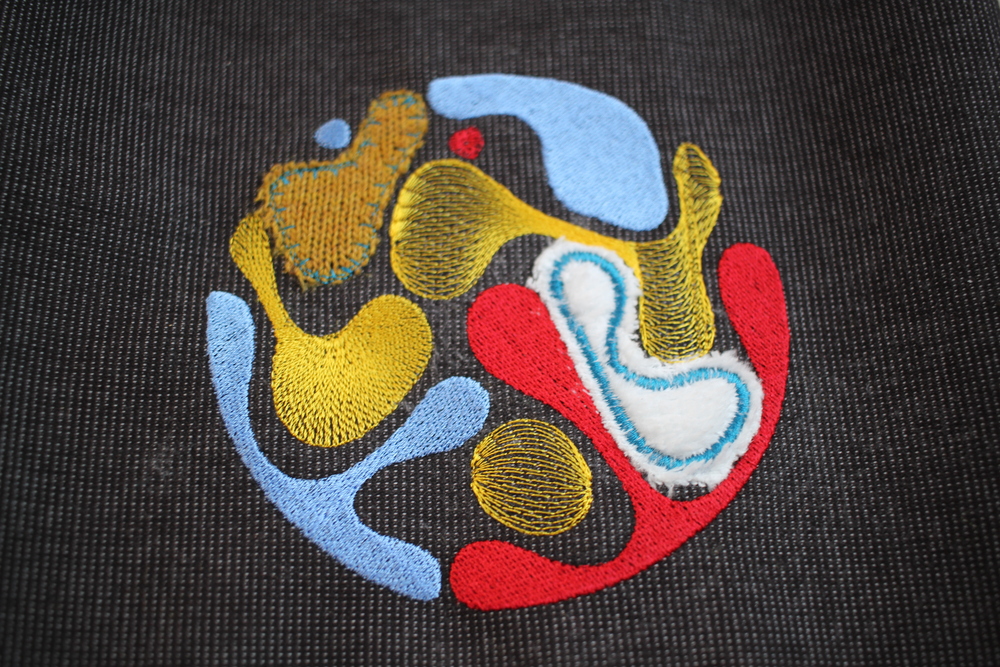
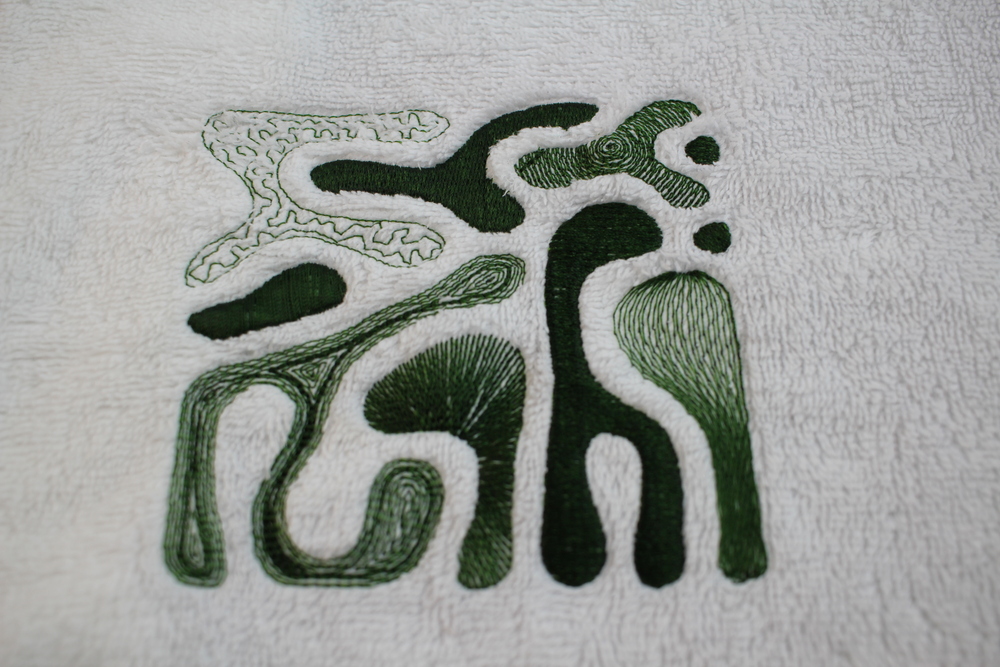
I was quite happy with these, and felt like this was a really good starting point for this idea!
At the end of the week, I also took some time to test out how I could extract a "positivity rate" from the messages. I tested a Python library called textblob, which has a french extension, textblob-fr.
With a few lines of code, I can extract a number between -1 and 1, that is a sentiment analysis over a text.
# https://textblob.readthedocs.io/en/dev/

from textblob import TextBlob
from textblob_fr import PatternTagger, PatternAnalyzer

text = "[SAMPLE TEXT]"

blob = TextBlob(text, pos_tagger=PatternTagger(), analyzer=PatternAnalyzer())

print(blob.sentiment[0])

for sentence in blob.sentences:
    print("==============================")
    print(sentence)
    print(sentence.sentiment[0])
Testing the textblob library for sentiment analysis
On a short text, the accuracy of the sentiment is not great, but still ok. I think what I really want from this is to see if there are any variations between the people.
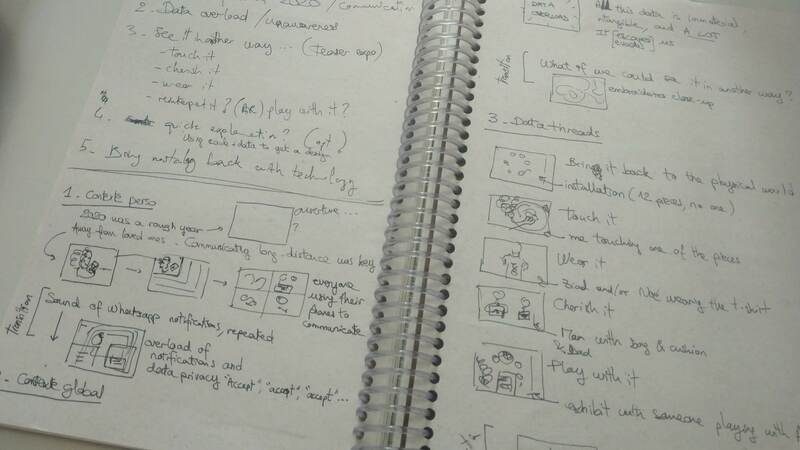
📖 Week 7 - Storytelling
📆 2021 - February 15th to 21st
This monday we had a review about the storytelling of our project; I made the following presentation, following a "WHAT/WHY/HOW" outline.
I had very useful feedback on this presentation, which I will also probably use for the final video presentation of the project.
-
The first slide (after the title) should be more impactful, especially on the data trace we leave behind us.
Comparisons can be made with other life facts, things we are more used to understand and have around us (how many times we brush our teeth, how much cheese we eat...) Could be shown in an every day casual scene with the data associated to it
-
Try to go from a casual day scene to a more global context
For example showing the servers where the data is, which we’re mostly unaware about
-
After this perspective, go back to a personal scale
How connected are you to your data? The goal is to provoke, open the discussion
My current thoughts about it is that I will stay with the size of the shape representing the number of messages, and have the density of the embroidery mark the positivity rate.
This week I also participated in a mentoring session with Emma, in the focus group "Art & Code"! I'd really like to include some kind of interaction in my work. Emma made me ask myself the right questions:
-
Do I want an interaction that is...
- Physical: a physical contact is needed for the interaction, for example a hidden button in the embroidery that triggers when pressed;
- Touchless: no physical contact, for example movement scanning, or pattern recognition with a phone
-
What kind of feedback do I want?
- a sound? For example giving context on the data, or even some part of the data
- a text, printed on a thermal printer?
- ...
I have to make decisions on this, and start experimenting and testing on small parts, before integrating this in the pieces.
📇 Week 8 - Preparing the data
📆 2021 - February 22nd to 28th
This week I extracted the data I need to make the Family embroidery series: the number of messages and positivity rates for each person, in a given time interval, over the year 2020. It took me quite some time to get the format I wanted from the WhatsApp file, but in the end here is the code I wrote to achieve it. The data looks like this:
[
    {
        "_comment": "7AM to 9AM",
        "names": ["Anne", "Audrey", "B\u00e9chara", "Diane", "Fadia", "Maya", "Nabil", "No\u00e9", "Ziad", "Élie"],
        "nbMessages": [5, 21, 21, 5, 33, 1, 20, 1, 32, 0],
        "nbChar": [131, 678, 1485, 83, 1009, 11, 919, 14, 1972, 0],
        "positivity": [60, 28, 27, 87, 39, 0, 27, 0, 21, 0]
    },
    {
        "_comment": "9AM to 11AM",
        "names": ["Anne", "Audrey", "B\u00e9chara", "Diane", "Fadia", "Maya", "Nabil", "No\u00e9", "Ziad", "Élie"],
        "nbMessages": [35, 86, 64, 39, 22, 33, 58, 1, 46, 41],
        "nbChar": [1329, 3715, 2783, 1181, 650, 606, 1920, 72, 1169, 2445],
        "positivity": [29, 16, 27, 12, 35, 16, 17, 0, 4, 13]
    },
    {...},
    ...
]
An excerpt from the data: each time interval over 2020
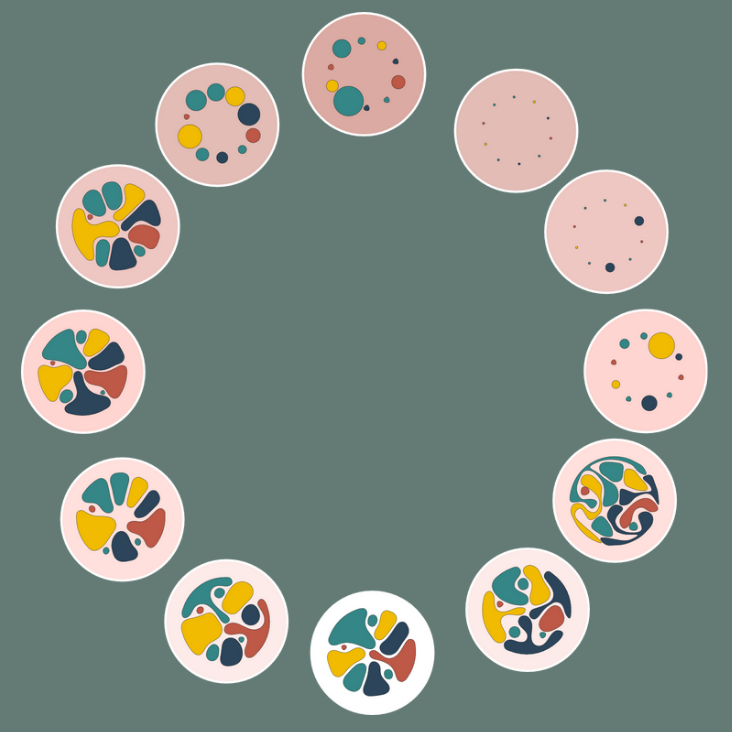
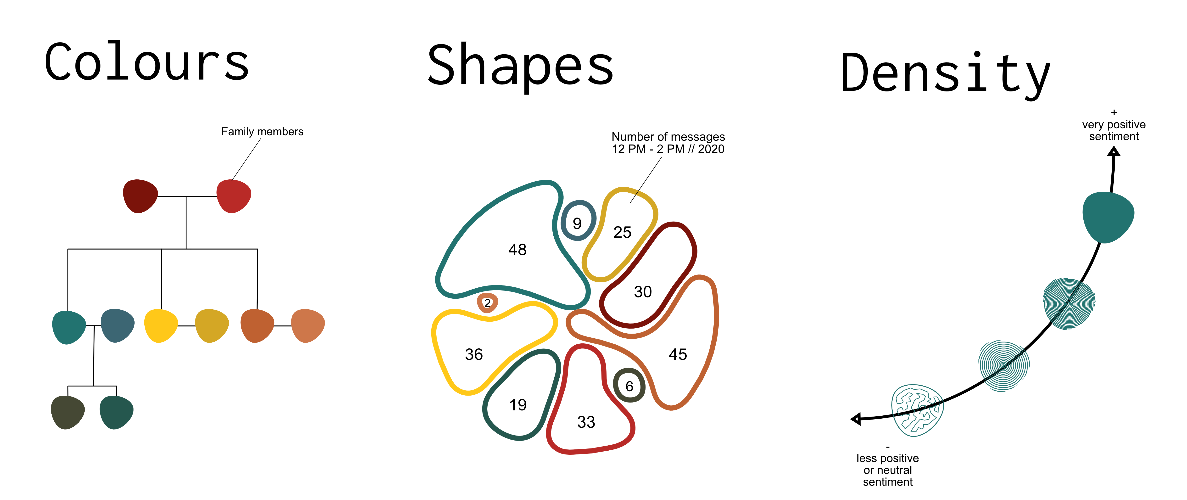
With this data, I generated a design in Grasshopper for each time interval I had selected. As in the prototype I made, each shape starts as a small circle. The circle is then divided in as many segments as the number of messages this person sent. Each segment then grows; so the bigger shapes are the person who sent a lot of messages. There is also a random element on the rotation of each of these segments, on which I plugged the positivity rate. So the more positivity the more "crazy" the shape will be.
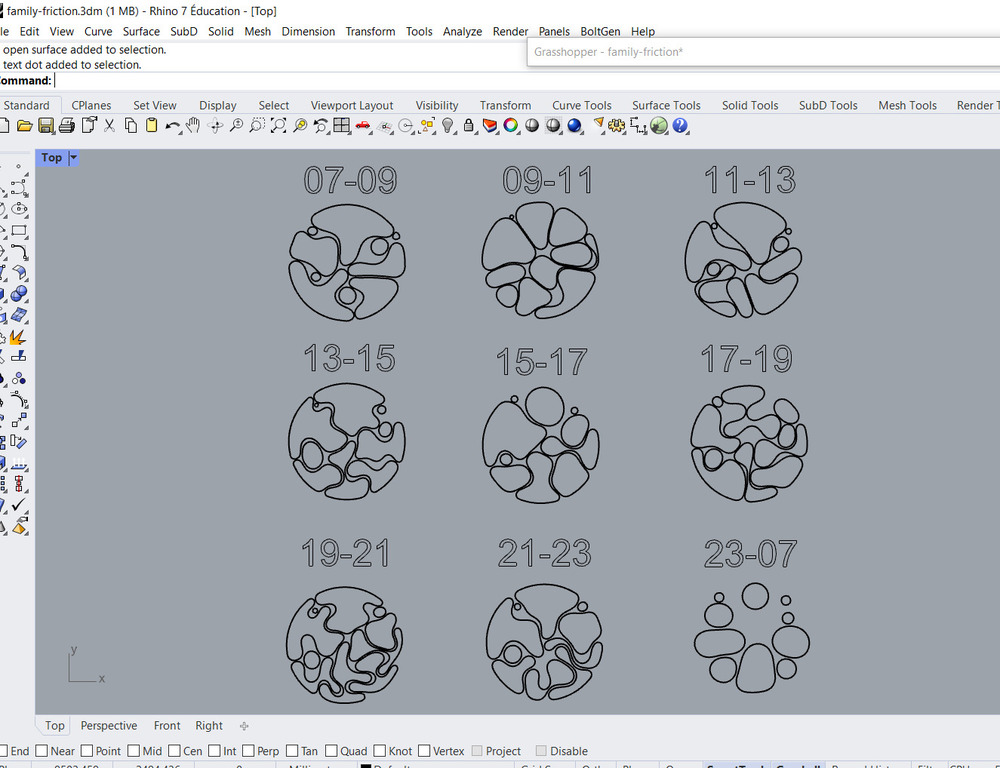
The shapes generated for each time interval (the hours are here for reference only)
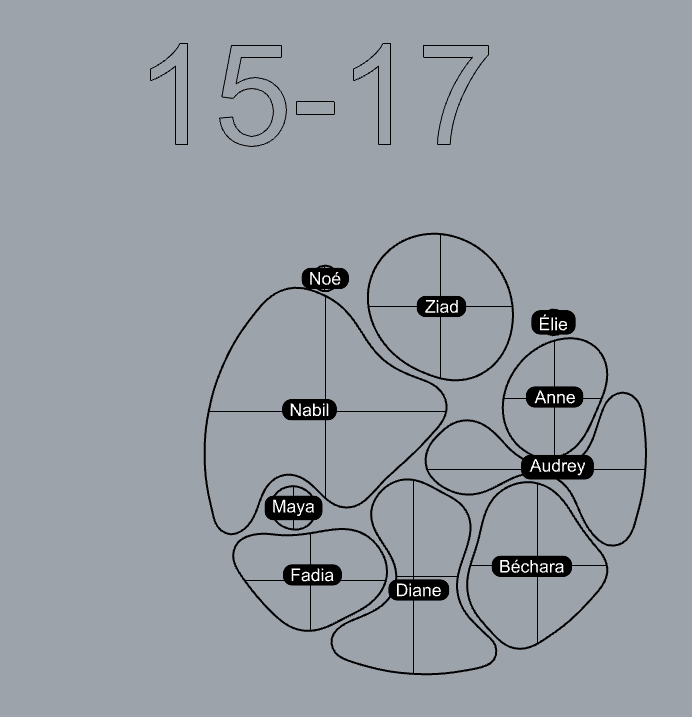
A copy with the names of each person, for reference...
I have to decide which colors I'll be using. There are 10 people represented here, but I don't want to use 10 different colors... I want to have 1 color for a "family unit" inside the big family. That would be 4 colours, which seems ok to me.
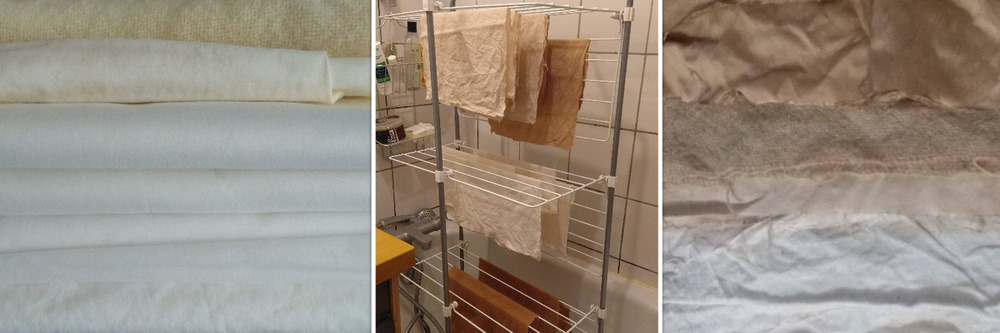
When seeing the series generated in Grasshopper, I thought it would be great if the background of the embroidery went from light to dark across the series, to show the passing hours. Pauline gave me the idea to dye it, and take out the fabrics from the dye bath at different times!
I loved the idea! I want something that is a bit neutral, not very bright, so I did not consider onion peels, which gave us a very strong color. Instead I'm trying with avocado, and probably post-mordanting with iron. I will try both and see what turns out better. I like the shades I can get with avocado, and I could get a lot of avocado quickly from my favorite Mexican restaurant 🌮🌮🌮.
These are my first tries at home, on scraps of cotton (textured, so not what I will use for the embroidery, but that's all I had in white):
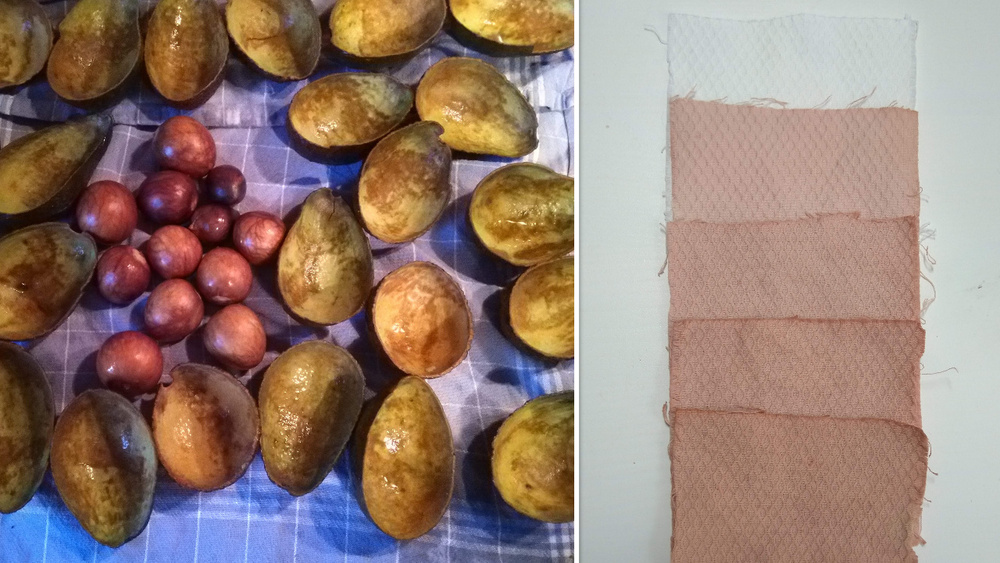
I took them out every 15 minutes, but I could have more shades in-between the white and the first one, and I could wait more time for the darker ones too.
On a completely other subjet, after the mentoring session where we talked about interactions, I tried my thermal printer and imagined what it could print when for example touching a part of the embroidery:
I liked this, but I'm not sure it's going to be relevant for someone who doesn't know the people involved in the data... After discussing it further, I realized I'm still not sure where to go with this idea of interacting with the pieces, which at this point means it's maybe not a good idea.
Using the thermal printer in this way also made me realize it would be better if the result of the interaction is connected to the people that interact with it. I decided to focus on creating a real-time interaction that I could show at the exhibit, something that shows how it works, how the data is transformed.
What I imagine is an installation with two pressure sensors, and microphones, connected to a computer. With the pressure and sounds, a design is generated on the screen, and then printed on the thermal printer. Could also be embroidered or printed?
🦠 Week 9 - Testing the fabrication
📆 2021 - March 1st to 7th
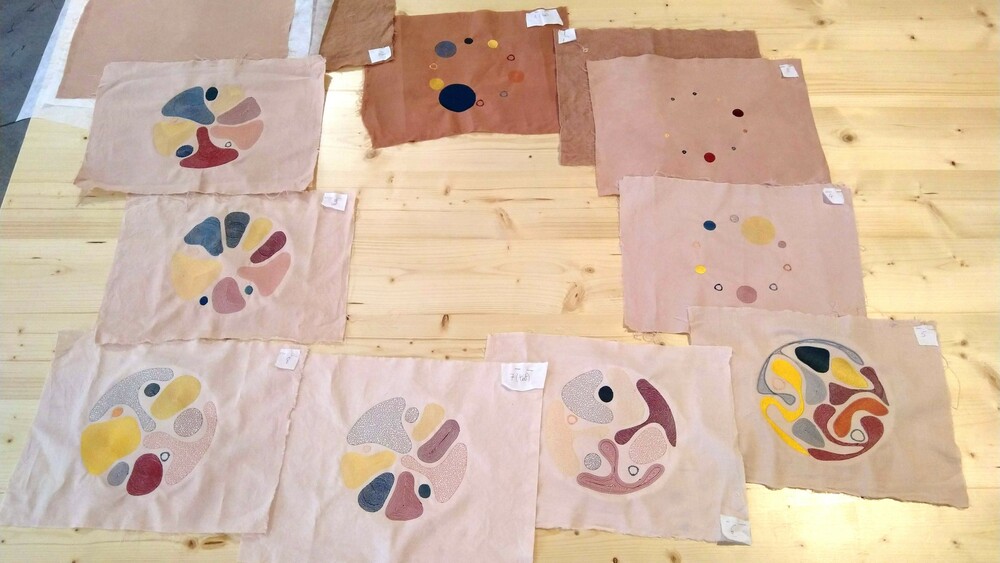
I prototyped a small version of the 9 embroideries:
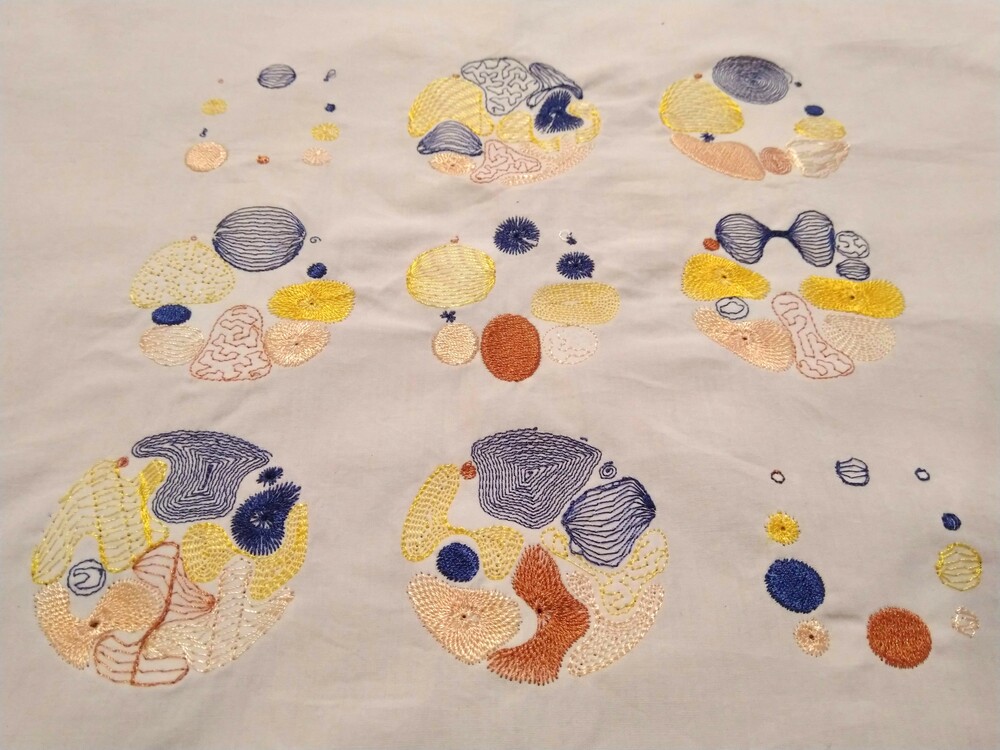
I wanted to see what the difference in density makes it look like overall. I also wanted to do a first color test, even though it was on white fabric.
After seeing this, I decided to generate them again, but with 12 time-frames, so that they would all be 2-hour time-frames:
🥑 Week 10 - Natural dyes & fabrication
📆 2021 - March 8th to 14th
I did some more embroidery density tests, because I was not happy with the results:
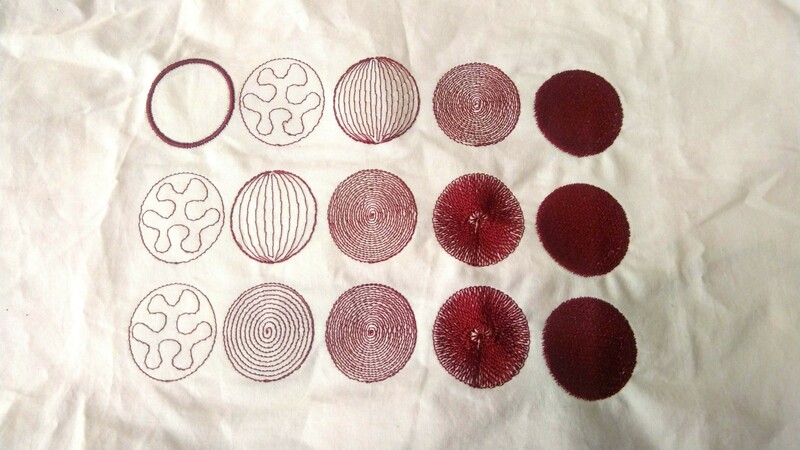
In the end, I decided to split it into 4 different densities instead of 5, because I felt it was more understandable.
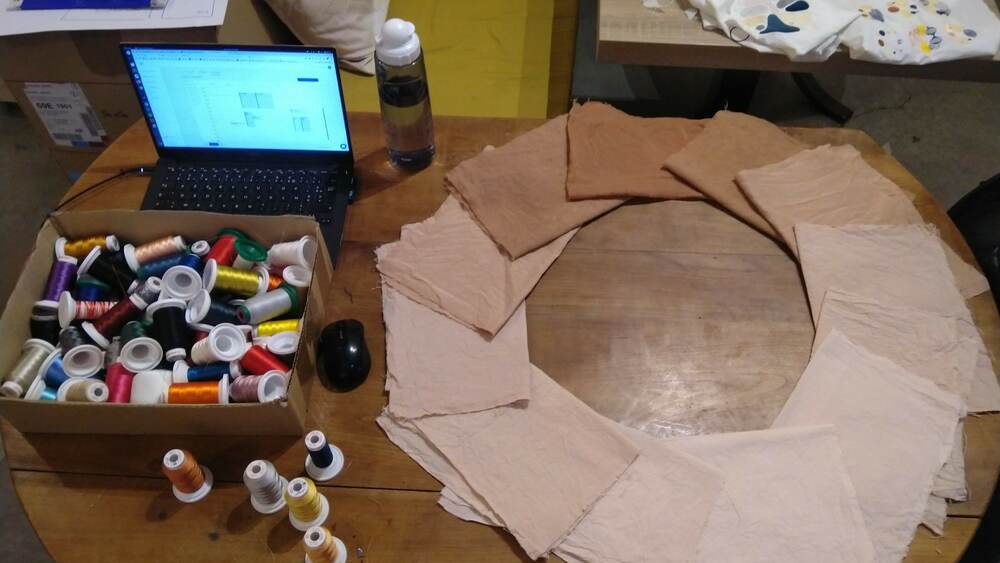
I found the fabrics I wanted to use: cotton, silk and wool, all scraps from the lab or my fabric stash. I went back to the Mexican restaurant to get more avocados, and used mainly the pits.
🤳 Week 11 - Interaction
📆 2021 - March 15th to 21st
After the mid-term reviews, I completely changed my mind about what kind of interaction I wanted for the exhibit: I wanted to really link it to the piece. I thought of augmented reality, and tried making an app that would show some of the messages sent, when scanning an embroidery.
I followed this tutorial video, and created the app with Unity and Vuforia. This is a test with my computer's webcam:
I quite like the idea, I could hide messages to find in the designs, showing some "slices of life" that happened at these times?
🏃♀️ Week 12 - Catching up
📆 2021 - March 22nd to 28th
This week went by so fast! We were organising a biomaterials workshop with Pauline, so I had very little time to work on the project!
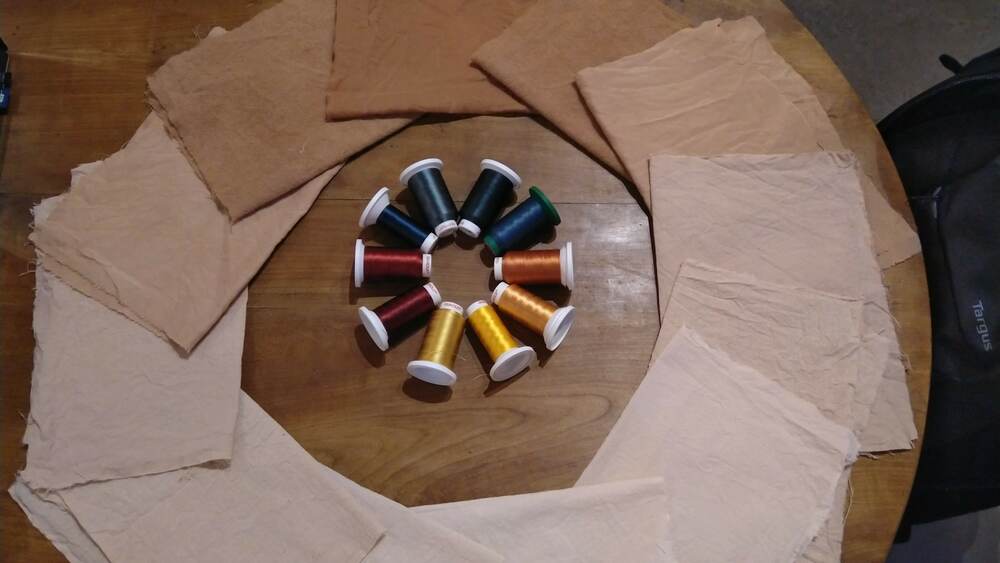
I did some more color tests on the final fabric, because I was not happy with the ones I had previously used. At first I wanted to use only 4 colours, but at this point I really wanted to give everyone their own colour, so that they could identify with it. So I was trying to choose 10 different colours, but still be harmonious... I went with a different colour for each family unit, and then shades of this colour inside the unit.
The different units are 4 people / 2 people / 2 people / 2 people, so these were the groups of colours I needed.
Two different colours tests. I did not like the blues.
The colours I ended up choosing, with the dyed fabrics.
I prepared the embroidery machine files with the different densities I had determined, using 4 different embroidery point styles, and started embroidering!
Almost done !
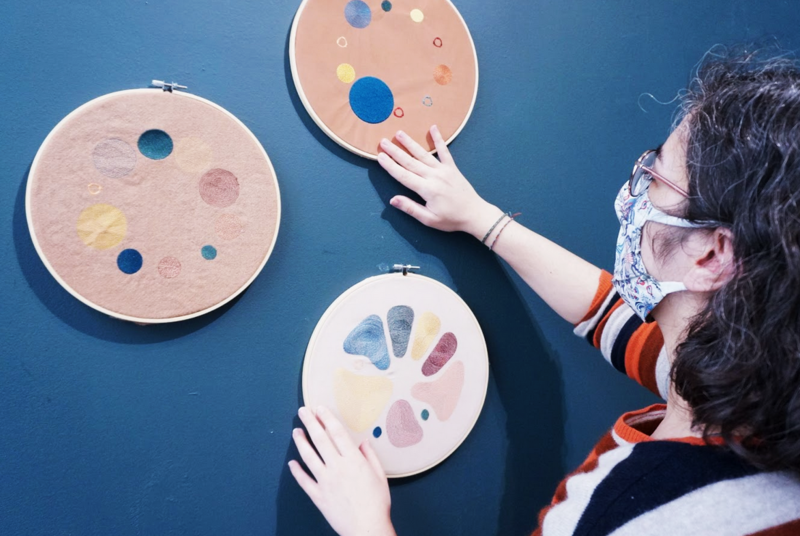
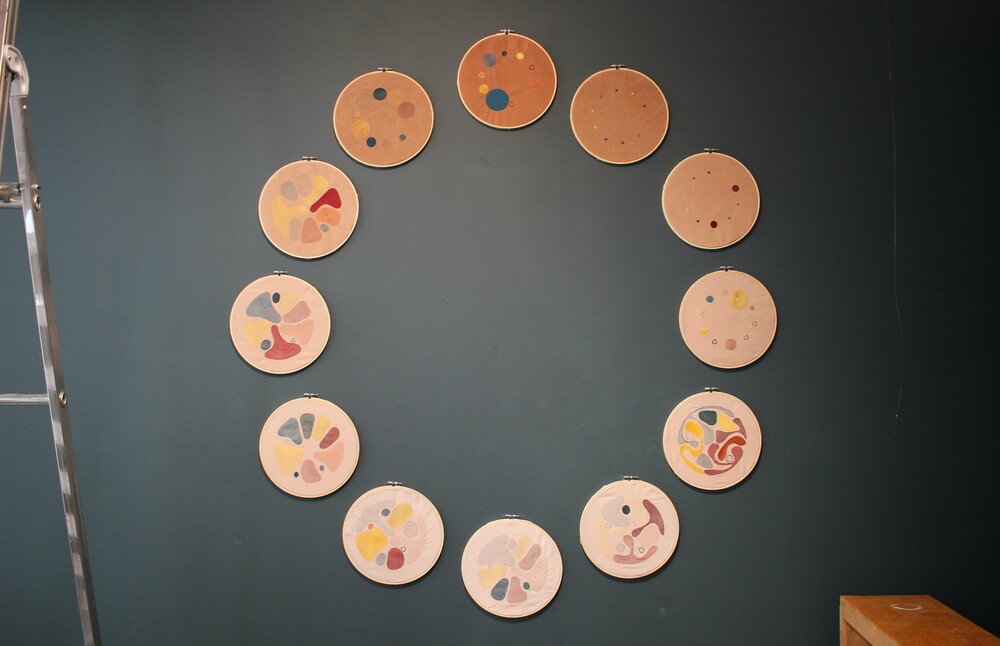
🖼️ Week 13 - Installation
📆 2021 - March 29th to April 4th
Time for the installation! I took up a wall of the lab to install and take pictures of the embroideries. I initially wanted to laser-cut the hoops, but unfortunately our laser cutter was too small for this, and the other labs in Lyon were closed or unavailable, so in the end I just bought a
I wrote different labels to accompany the piece:
This week I also tried to start working on a script for the presentation video...
...and I finalize the AR app with the final pictures of the embroideries screenshot of unity
🎥 Week 14 - Video & presentation
📆 2021 - April 5th to 11th
Last week ! I mainly worked on the video and the presentation. The video is meant to be a teaser for the exhibit. Pauline helped me film, and I used the free software VSDC to edit it.